
Example charts
Many of the charts that are generated by the coverageAnalysis plugin include a Plot menu that allows you to change characteristics of the chart. For example, you can show both strands.
Click a chart's options icon
 (in the top right corner of a chart) to open the chart s viewing options panel.
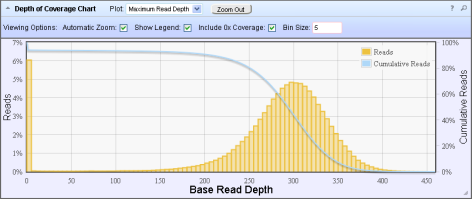
In the Depth of Coverage chart above, the left Y-axis (% reads) is the number of reads at a particular read depth (or bin of read depths) as a percentage of the total number of base reads. The right Y-axis (% cumulative reads) is the cumulative count of the number of reads at a given read depth count is at least read depth, as a percentage of the total number of reads. If your analysis includes a regions of interest file, this chart reflects only Target Regions (reads that fall within a region of interest).
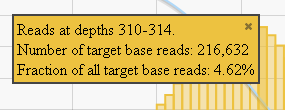
In most charts you click on a data point to open a detail panel for that data:
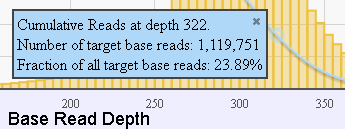
In this chart, the blue curve measures the cumulative reads at that read depth or greater. Click a point on the blue curve to open the blue detail panel for that read depth:
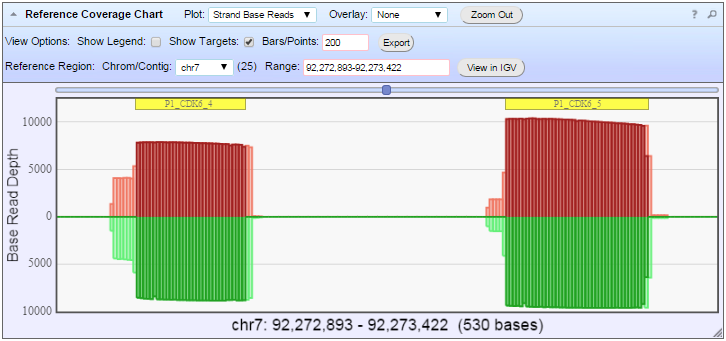
The following Reference Coverage Chart is shown with the Strand Base Reads option:
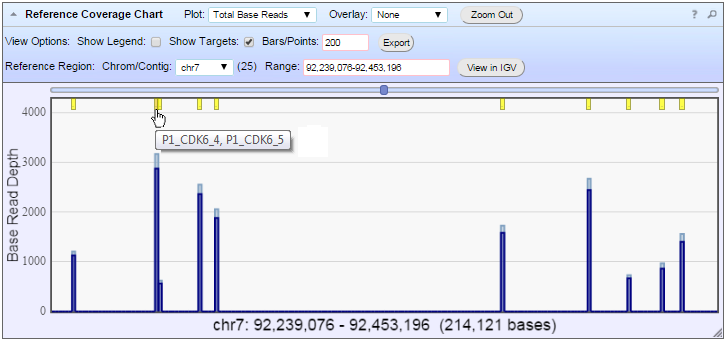
You can also zoom in on a region of interest.
 opens a description of the chart.