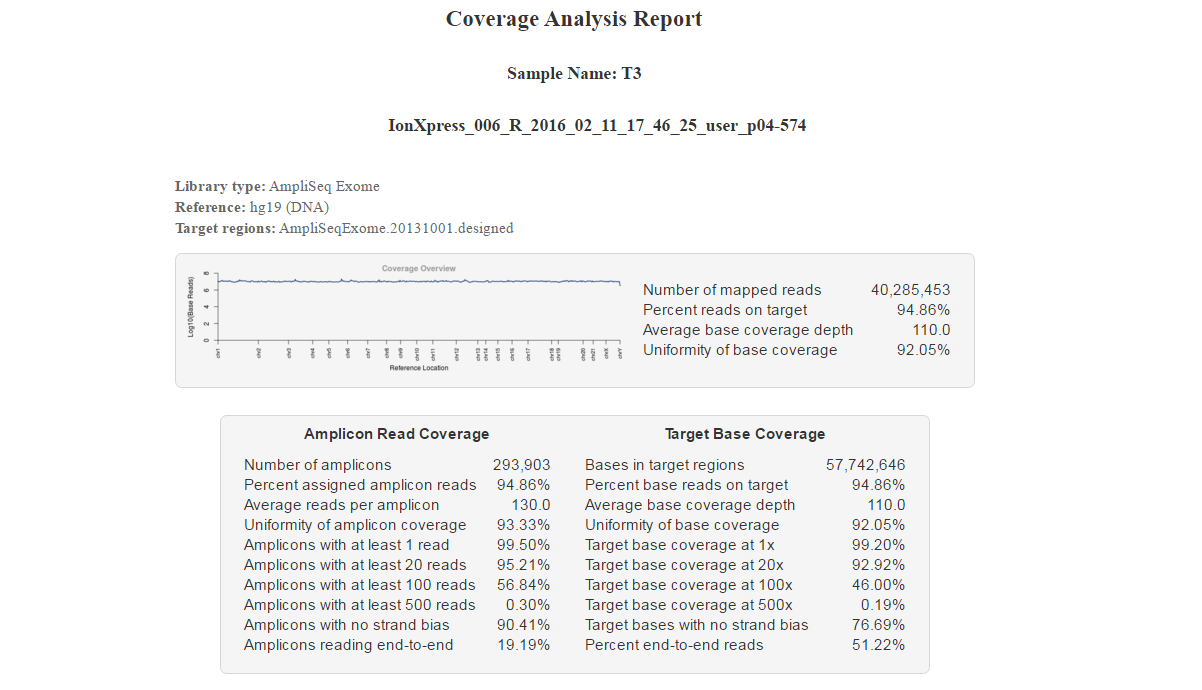
Example statistics
The following is an example of the plugin statistics for an AmpliSeq Exome run.
Note:
Almost every statistic, plot, link and functional widget in the report provides tooltips with definitions. Hover over a heading or description in the report to view the tooltip.
The Reference Coverage chart is an overlay of where target regions are defined and overlap on the reference.

