Review run results
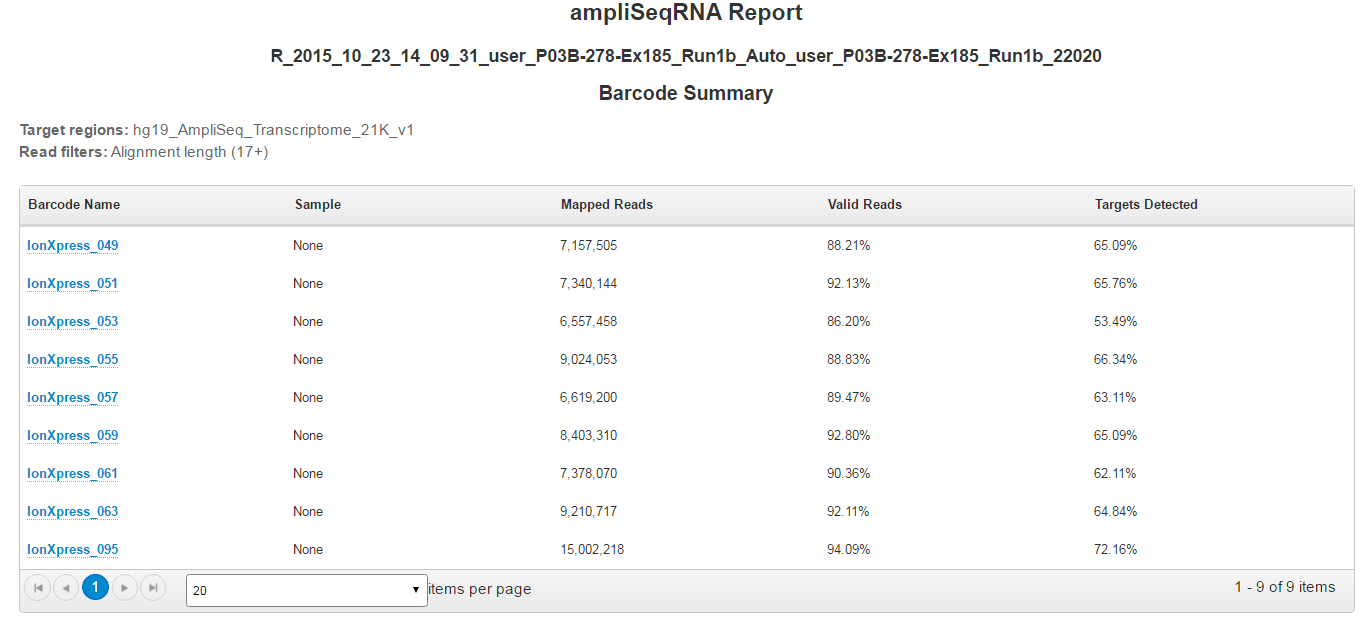
The ampliSeqRNA plugin generates an initial summary report that lists the samples, the number of mapped reads, the percent of valid reads, and the percent of targets detected. A series of log2 RPM pair correlation plots are included for rapid correlation analysis. Microsoft™ Excel™-compatible reports are also generated, including differential expression tables. Additional details around read coverage are also provided on a per-barcode basis, along with a list of gene annotations for each sequenced region
After your sequencing run completes, review results on the Run Summary page.
- Under the Data tab, click Completed Runs & Reports, then search for your run.
- Click the Report Name link to open the Run Summary for your run.
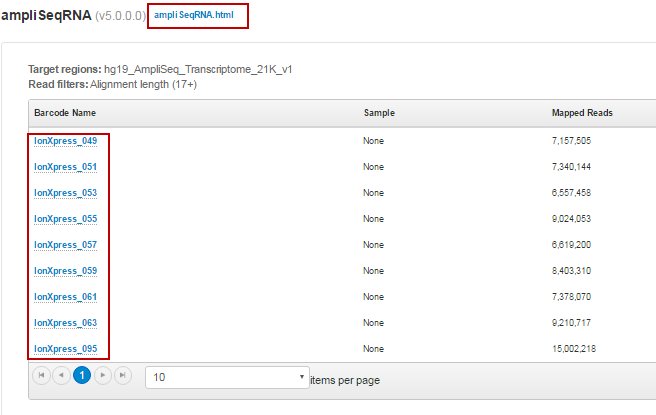
- Scroll down to the ampliSeqRNA section, then click the ampliSeqRNA.html link to open the ampliSeqRNA Report – Barcode Summary for all barcodes. Alternatively, click individual barcode names to see the results for an individual barcode.
- In the Barcode Summary table, review your Mapped Reads, Valid Reads, and Targets Detected by barcode.
- At the bottom of the report, click the Distribution Plots, Correlation Heatmap, Correlation Plot, and Gene Heatmap tabs to review the data graphically.


